Cherry APM
Get in-depth insights to make your applications available anytime, anywhere.
Introducing Cherry APM
Observability of application performance is not an option for your businesses.
“A 1 to 10 second delay in load time increases bounce rates by 123%.”
“Core Web Vitals” core algorithm update in June 2021
“32% of loyal customers will leave after one poor experience.”
PwC Future of Customer Experience Survey 2017/18
In a multi-cloud application environment, customer expectations around digital experience are extremely high.
It is critical to monitor application performance at all stages to provide your clients better user experience.
How Application Performance Monitoring (APM) solution works
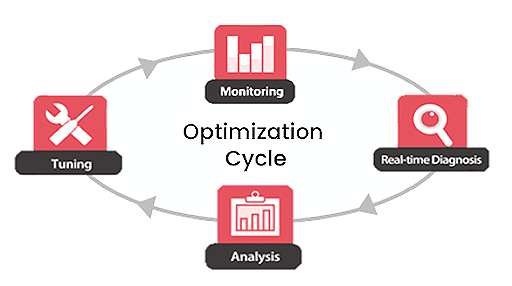
- Monitor the entire application by tracking the most critical application performance monitoring metrics
- Identify and alert errors and the source of issues in real-time
- Analyze the problem with diverse performance analyzer
- Optimize application performance quickly referring to an insight from the solution
-

Why Cherry APM?

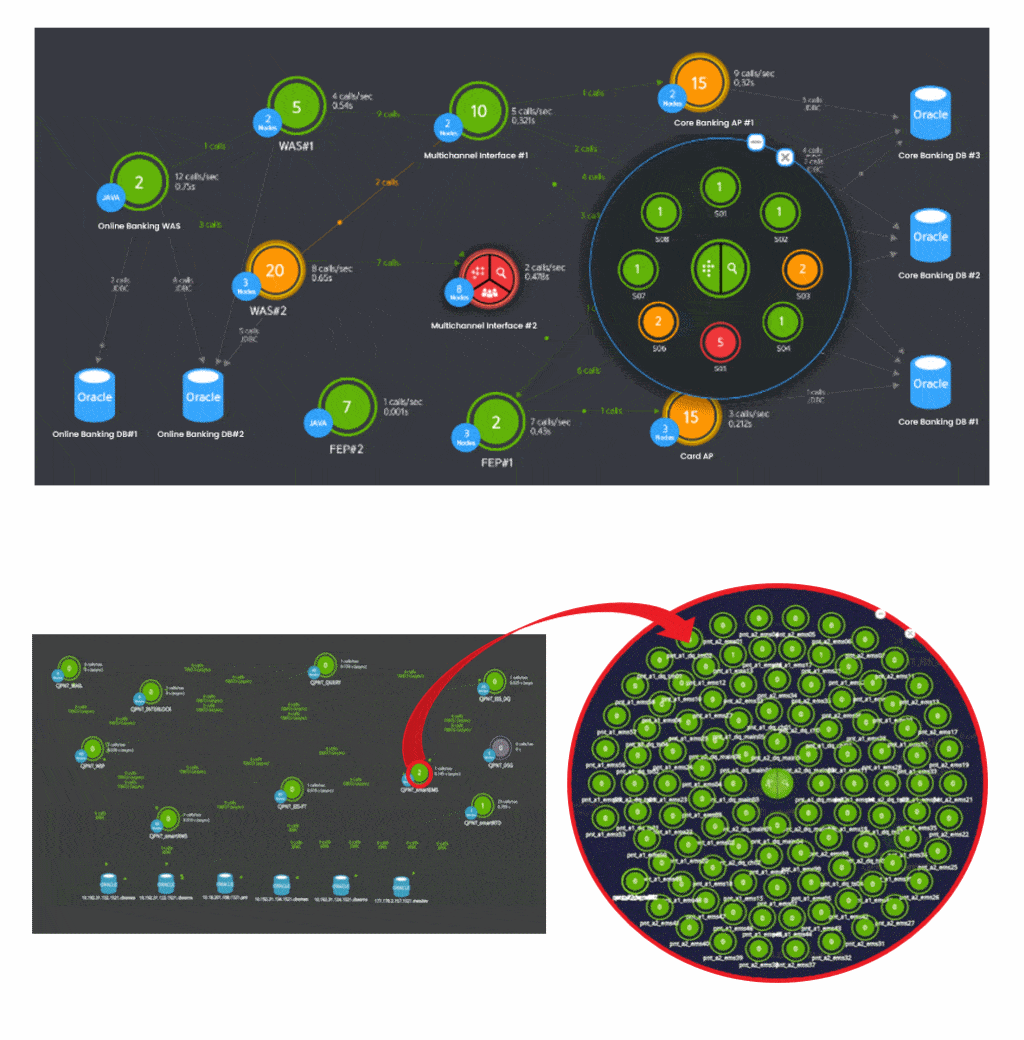
End-to-End Transaction Processing Flow
- Monitor End-to-End transaction from End User, Web, WAS, and
Database to External Agency with a consolidated topology view - Pinpoint performance issues automatically from each tier in real-time
- Monitor active response time between each transaction
- Provide an alert when there is critical performance diagnosis data
-
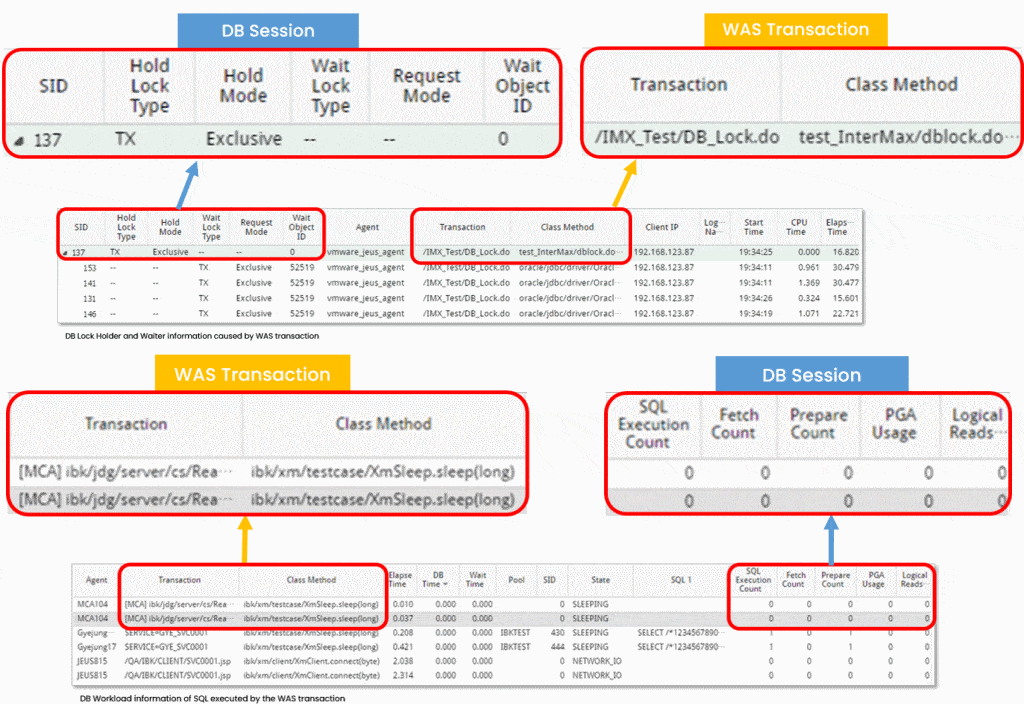
Web Application Server(WAS) Transaction – DB Sessions 1:1 Match
- Provide in-depth insights with integrated information of WAS-DB for each transaction
- Identify DB session issues connected to WAS transaction quickly with DB Lock Holder and Waiter information
- Monitor DB session performance by collecting DB Elapsed time, Workload, and Wait status information
-


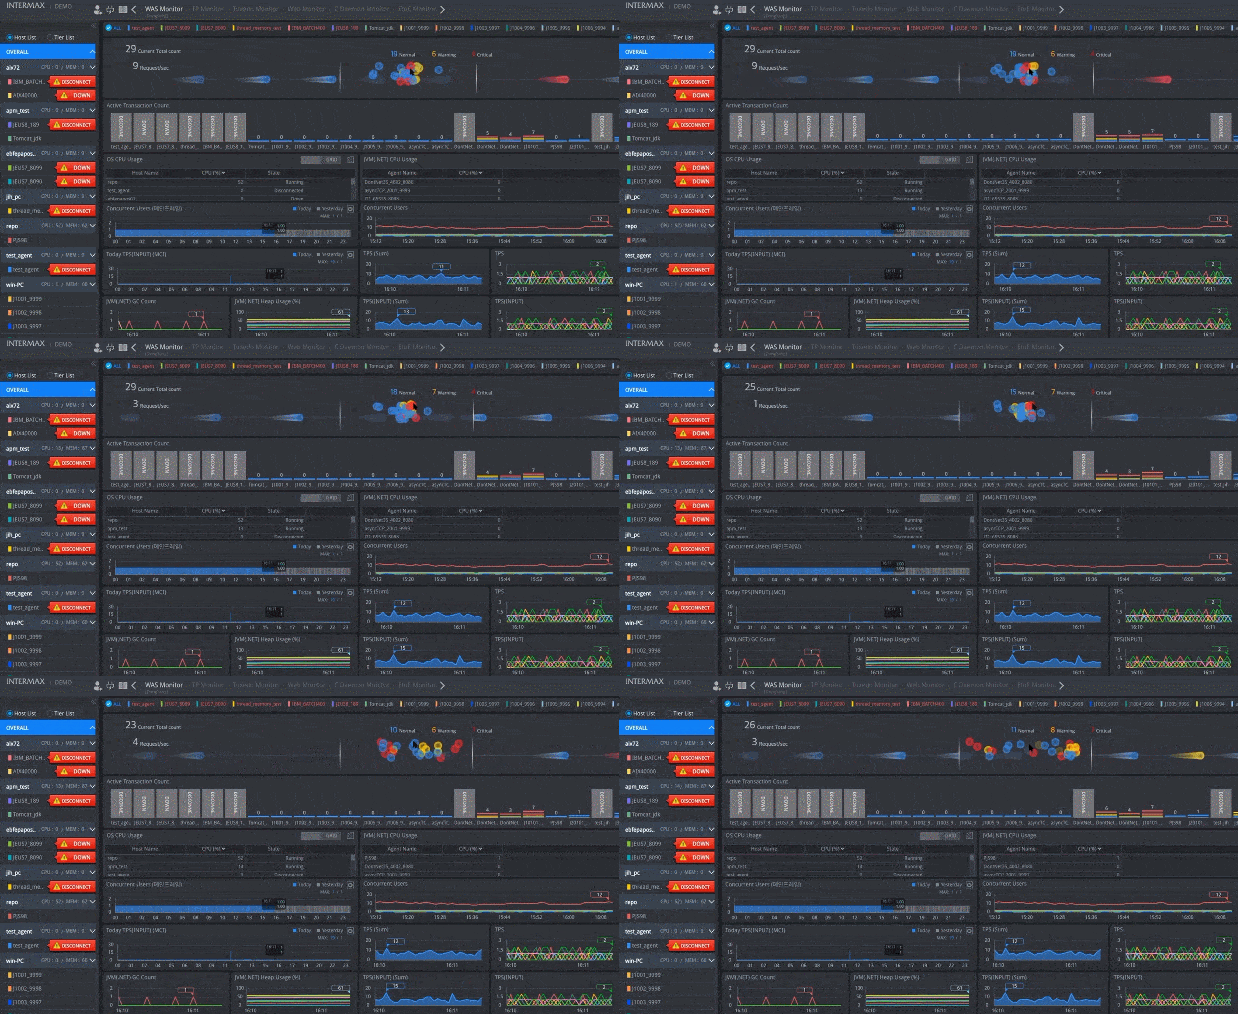
Real-Time Monitoring
- Monitor real-time transaction situation of the entire system
- Provide active transaction information on the dashboard from diverse
points of view - Collect real time application monitoring data every second
- Store transaction history in 3 second units to facilitate a post analysis for
optimizing application stability -
Cherry APM provides

End-to-End Performance Monitoring
Help to find quick resolutions for system failures by tracing end-to-end transaction processing information

Regular Report
Provide various types of report by indicators daily, weekly, and monthly to give you an insight for a future performance trend

Performance Issure Alert
Notify the failure immediately via SMS and e-mail. Support to analyze and resolve the exact cause of problem quickly

WAS-DB Integration
Identify simultaneous information of WAS transaction and DB session in real-time

Real-Time Monitoring
Collect the real-time status for all nodes performing transactions

Customizable Dashboard
Make your own dashboard simply with drag & drop for the better UI configuration

Memory Leak Tracing
Investigate each transaction and memory size of the object used to detect memory leak

WAS-DB Integration
Identify simultaneous information of WAS transaction and DB session in real-time

Real-Time Monitoring
Collect the real-time status for all nodes performing transactions

Customizable Dashboard
Make your own dashboard simply with drag & drop for the better UI configuration

Memory Leak Tracing
Investigate each transaction and memory size of the object used to detect memory leak

“ Cherry APM helped us to monitor our application performance easy with an intuitive view of overall flow and a notification about an issue or any abnormal indicator. I’ve highly recommended Cherry APM to several companies so far.”
– Manager of System Deployment, Korea’s Leading Financial Institute –
Over 300 customers in diverse industries trust Cherry APM.

Ready to try Cherry APM?
Contact us to learn more about our solutions

