Cherry DPM
Manage your database performance in real time and respond to problems immediately, whenever or wherever they occur.
Introducing Cherry DPM
Korea’s leading database performance management solution lets you proactively monitor your databases, quickly recognize problems and effectively analyze bottlenecks.
Over 450 clients in 29 countries with 4,000 database servers use Cherry DPM, including AT&T, Samsung, LG Electronics, Hyundai, Toyota, Fujitsu and China Telecom.
Clients
Countries
Database Servers

Diagnosing database problems is key
Diagnosing the exact cause of a database problem is actually more important than solving it.
Unfortunately, users now view a lot of data in different environments for different reasons. Database varieties have proliferated, too. All this makes identifying database problems very difficult.
The costs of database failures can be enormous. Small errors can shut entire factories down, causing massive losses in a short time. Identifying database problems quickly – before losses mount – is critical.
Seeing everything, any time, any place
Cherry DPM is a specialized, proactive tool for managing database performance. It is designed to increase management efficiency and system operations through advanced features such as real-time monitoring, historical data logging, diagnosing, analyzing and tuning.

Monitoring
- Real-time monitoring
- Comprehensive dashboard
- Drill down traceability

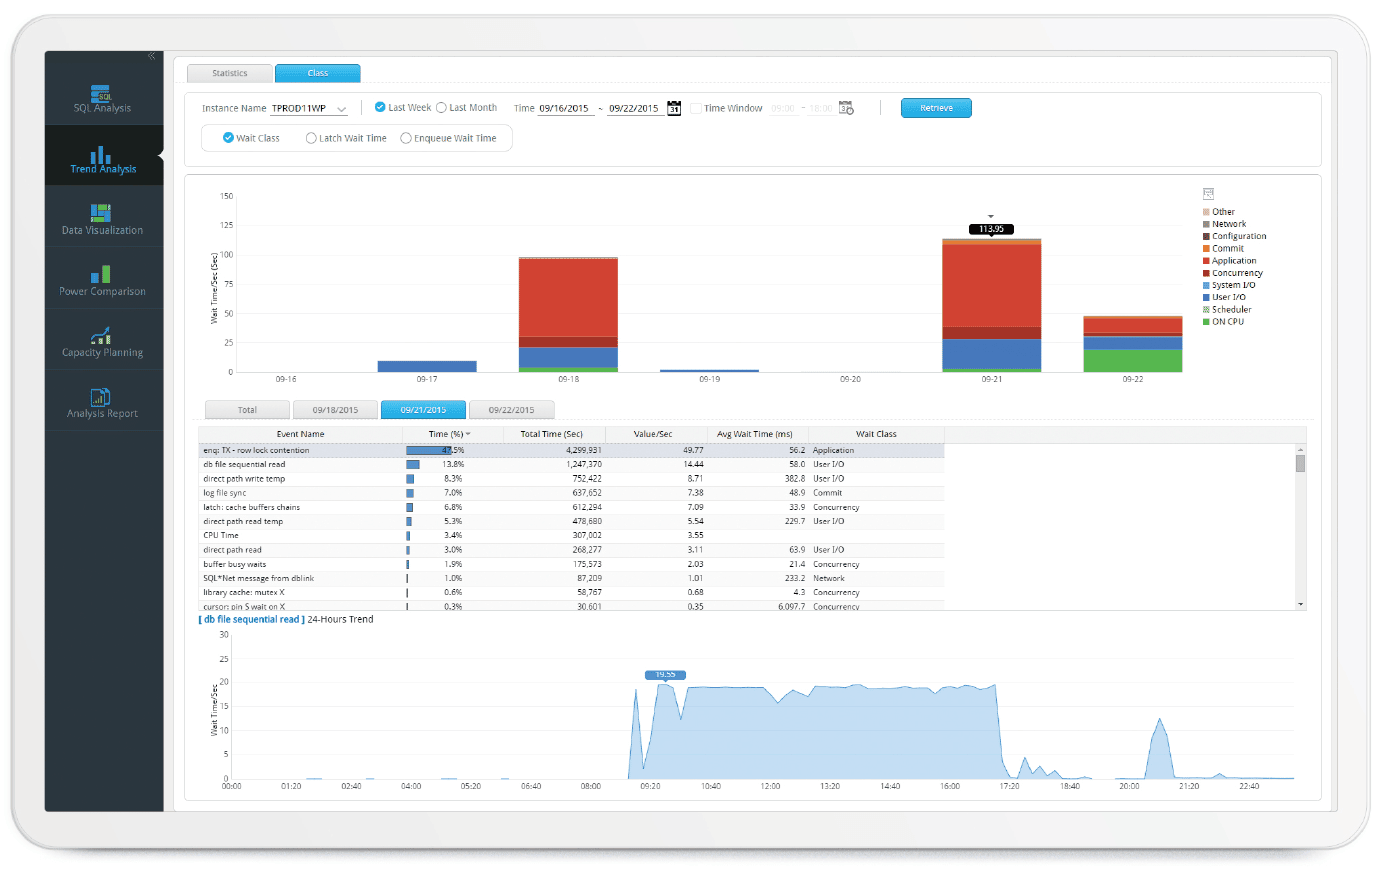
Analyzing
- Real historical records
- Bottleneck/wait event analysis
- Analysis of one-second data
Visualizing
- Datapath view
- Hotspot view
- 2D/3D dashboard
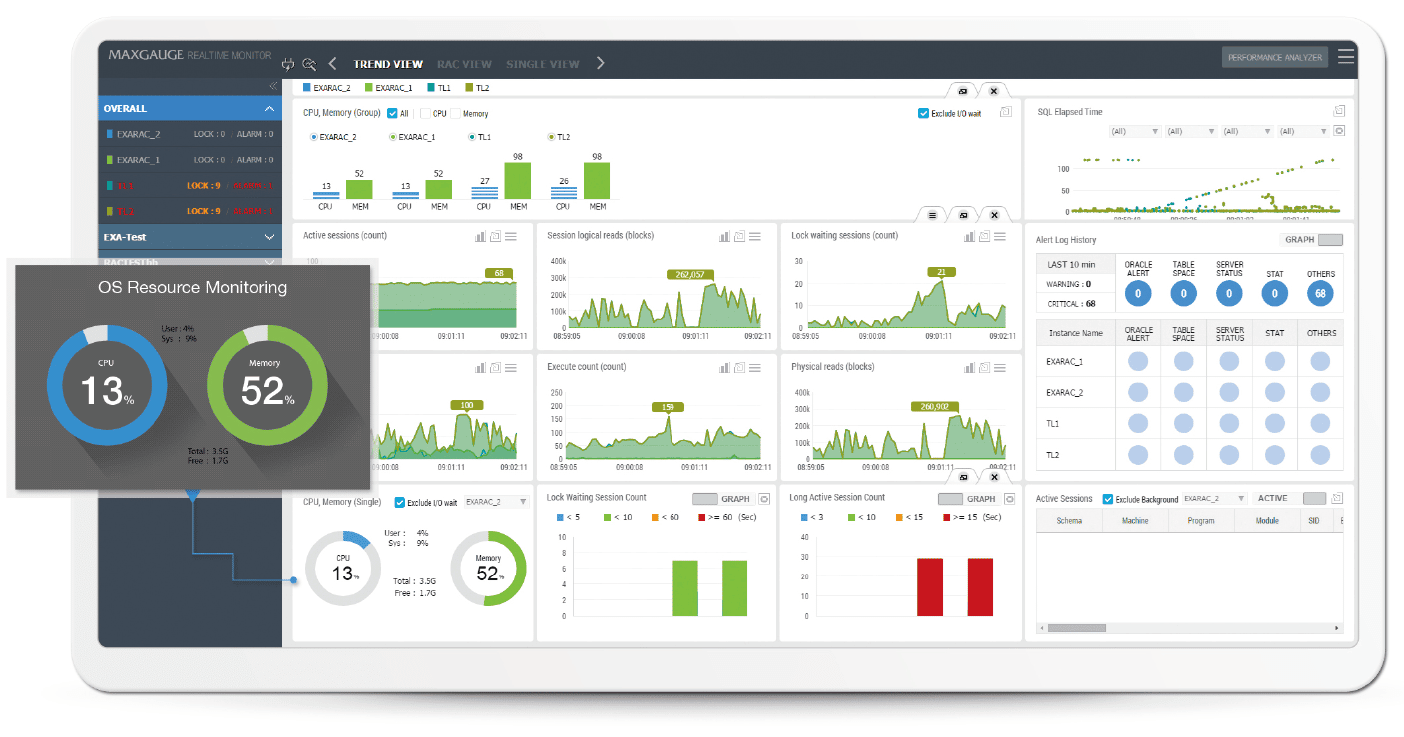
Real-time monitoring
Cherry DPM collects performance logs of all running databases in real time, providing instant alarm notifications and accurate post-error analysis.
Even when your database hangs, monitor it with Cherry DPM’s DMA and API call methods. Check the operating status of the system in real time and react immediately to issues.
Get all your info upfront
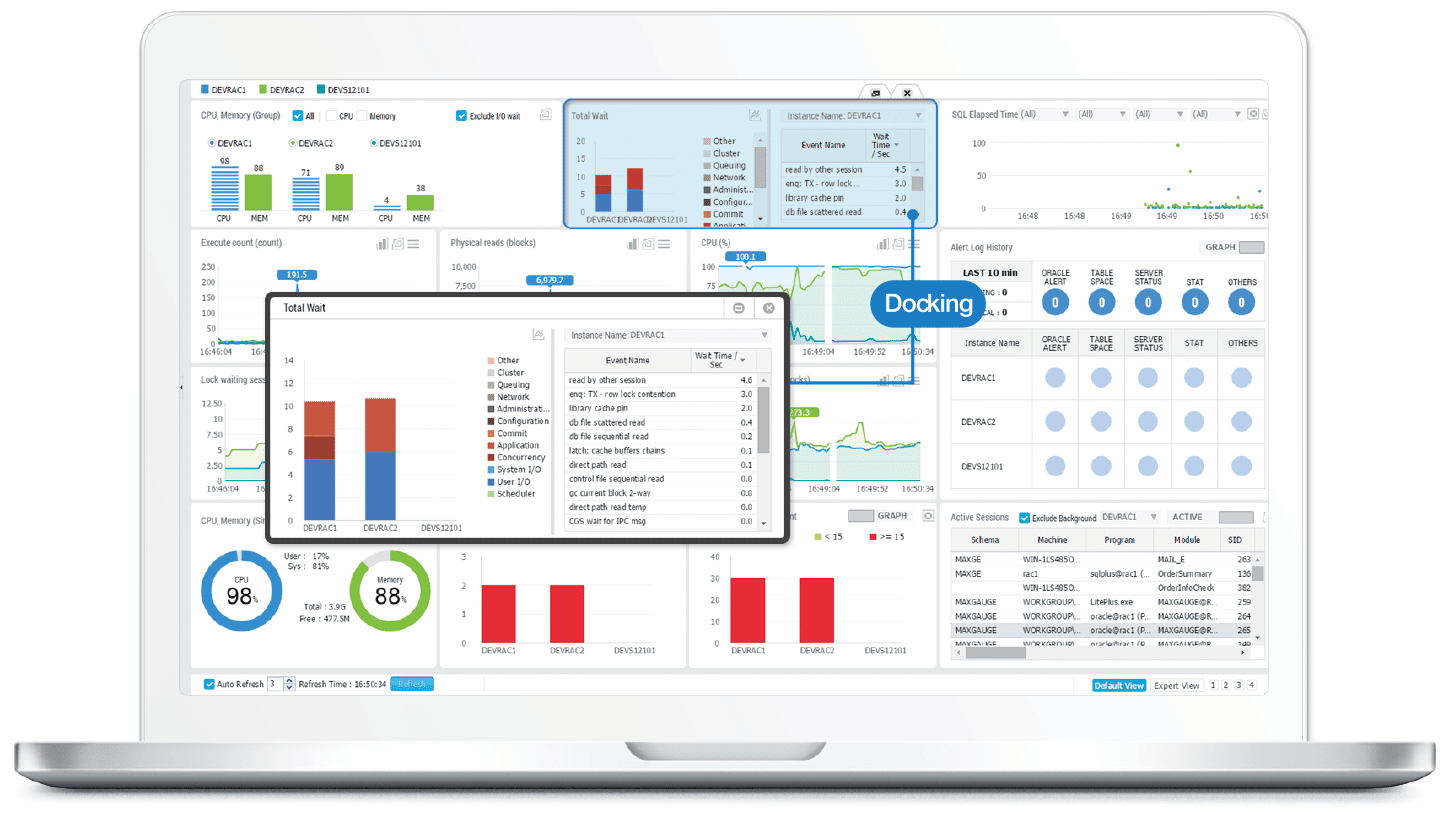
Cherry DPM makes monitoring multiple database instances easy with an integrated instance dashboard that puts all instances on a single screen. Blocks that represent instances change color to indicate problems – warnings are in yellow, while critical situations are in red.
Choose from 2D or 3D dashboards, and use the dashboard’s docking feature to place performance stats wherever you want them to create custom UIs.
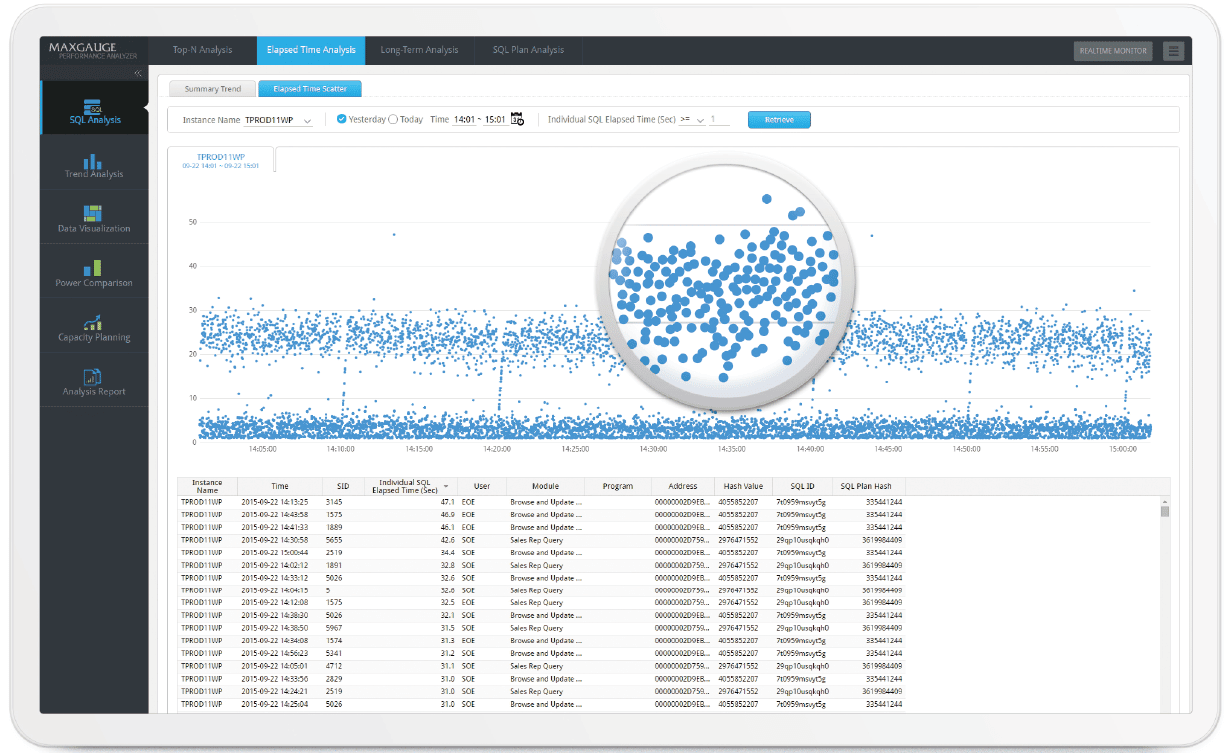
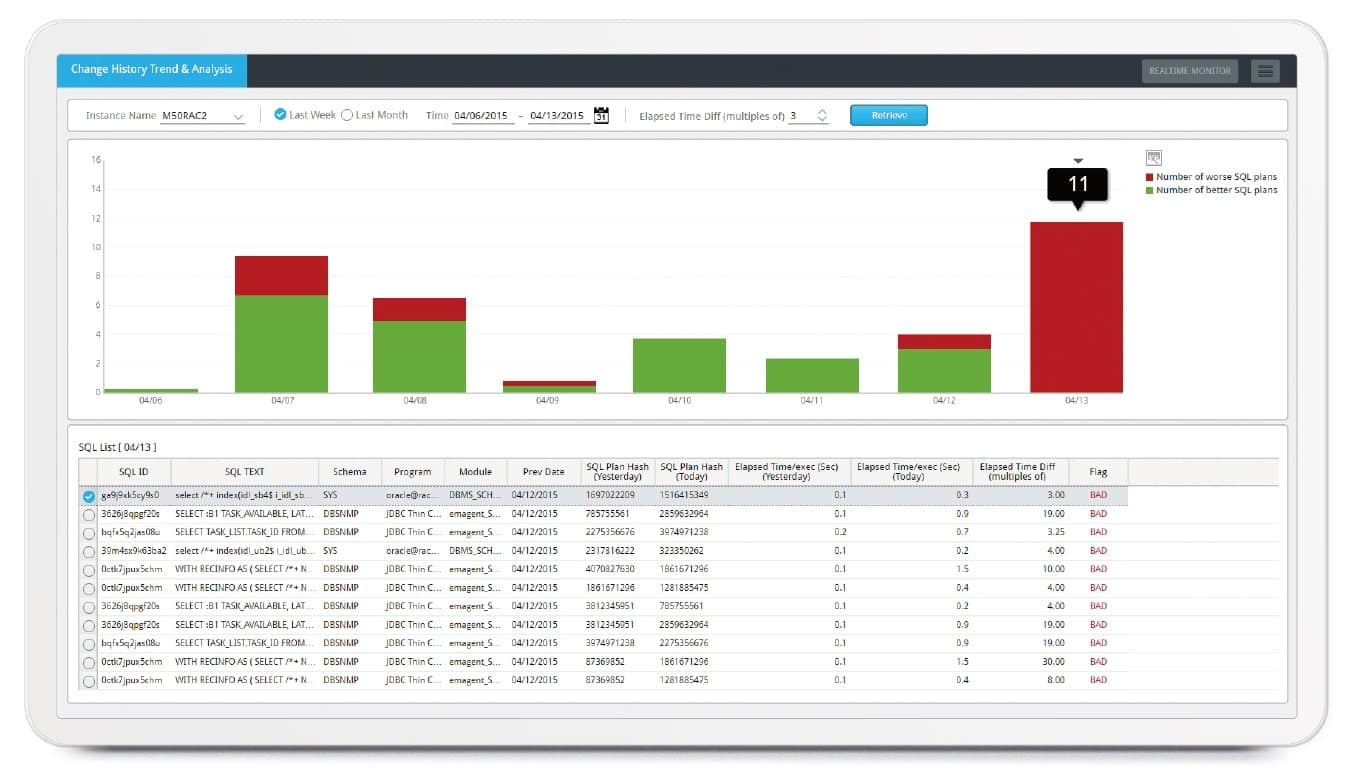
Tuning up your database through handy performance analysis
Better than the rest
Other DPM solutions are designed for overall management of all stacks and do not provide specific data summaries. One popular solution offers just a single instance per scree, rather than a snapshot view. Additionally, competing ‘real-time monitoring’ requires 15 second refreshes.
Cherry DPM, on the other hand, is specialized for database performance management. It pinpoints performance issues in real-time and precisely analyzes bottlenecks in one-second intervals. You can simultaneously monitor multiple databases, too.
Cherry DPM supports multiple database formats, including Oracle, SQL Server, DB2 and MySQL.

Ready to try Cherry DPM?
Contact us to learn more about our solutions